


Bootstrapped vs Equity-Backed SaaS Companies: SaaS Capital’s 2026 Growth and Spending Benchmarks
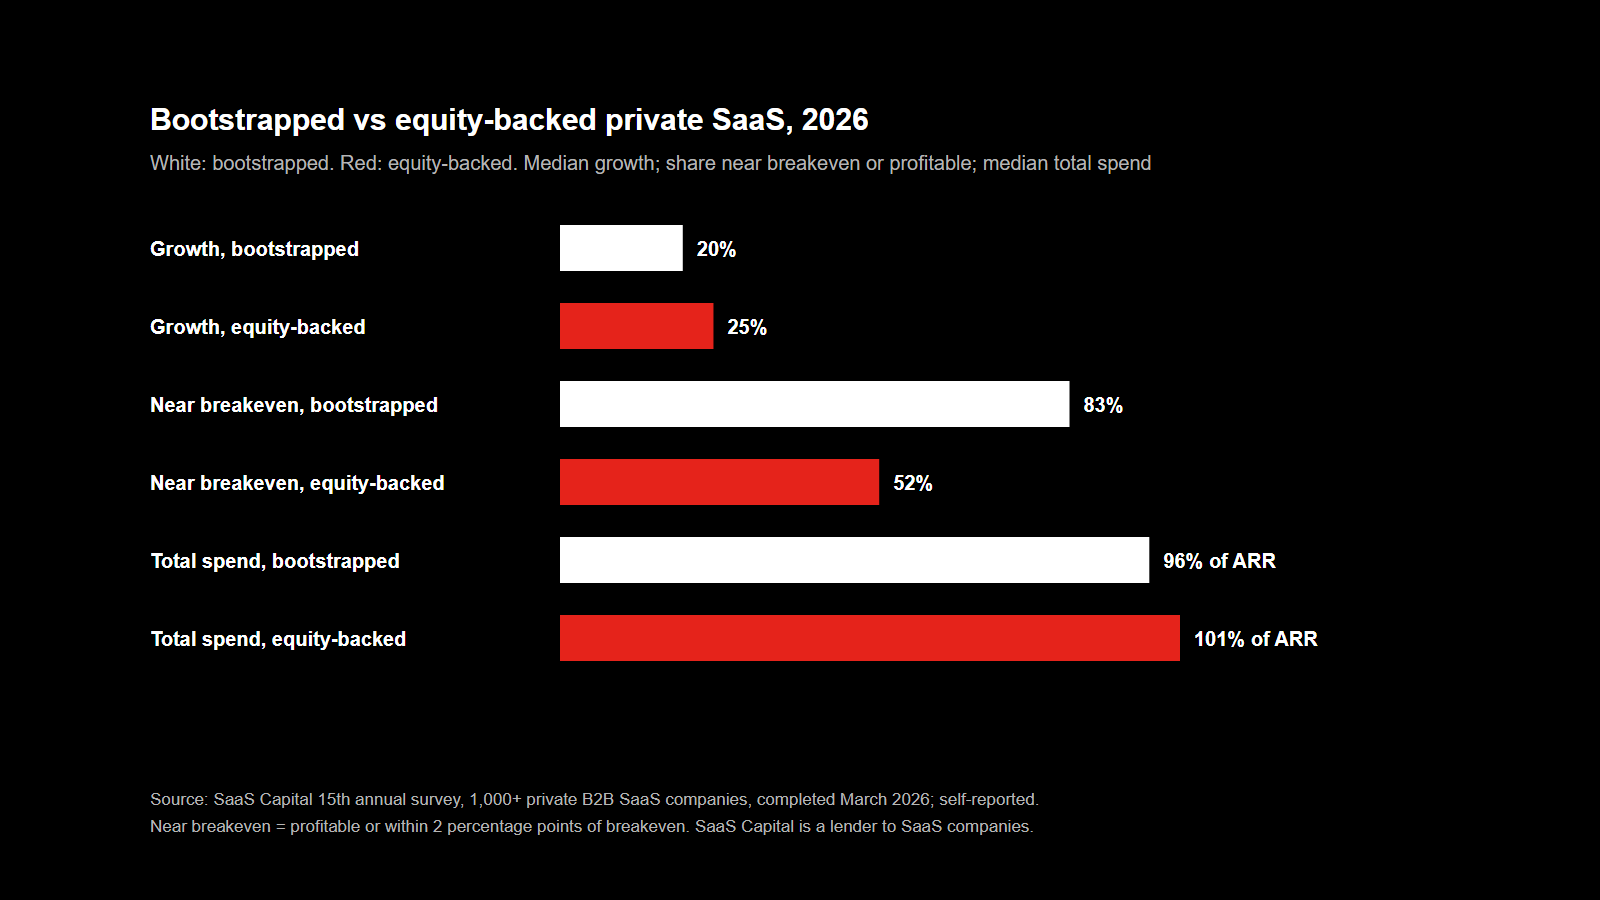

Bootstrapped private business-to-business (B2B) software-as-a-service (SaaS) companies reported median revenue growth of 20%, against 25% for equity-backed companies, according to 2026 benchmarks published by SaaS Capital. The figures come from the firm’s 15th annual survey of private B2B SaaS companies, completed in March 2026 with more than 1,000 respondents. SaaS Capital is a lender that provides long-term credit facilities to SaaS companies, and the survey figures are reported by the companies themselves.
Growth
The median growth rate across all companies in the survey was 22%, down from 25% in 2024, according to SaaS Capital’s growth-rate research brief. Bootstrapped companies reported median growth of 20%, down from 23% in 2024. Equity-backed companies reported 25%, unchanged from the previous year.
In all, 7.3% of companies reported flat or negative growth in 2025, up from 6.9% the year before. The highest share in SaaS Capital’s series was 13%, in 2020. The firm says equity funding has historically been associated with faster growth, but that the relationship may not be causal.
The brief also links growth to net revenue retention (NRR). SaaS Capital defines NRR as the recurring revenue a company collects from a year-earlier group of customers, including upsells and price increases, divided by that group’s revenue a year before. Companies with NRR of 100% to 110% grew 5 percentage points faster than those at 90% to 100%, according to the brief.
Spending and profitability
Survey takers were asked what percentage of revenue they spend on each department, with totals above 100% for companies that are not profitable. Median total spending was 96% of annual recurring revenue (ARR) for bootstrapped companies and 101% for equity-backed companies, according to SaaS Capital’s spending benchmarks, published on 10 June 2026.
On that basis, 83% of bootstrapped companies were profitable or within two percentage points of breakeven, compared with 52% of equity-backed companies. Put the other way, 17% of bootstrapped and 48% of equity-backed companies were operating at a loss, SaaS Capital said.
The largest gaps were in five departments. Equity-backed companies spent 70% more on sales, 100% more on marketing, 56% more on research and development (R&D), 64% more on general and administrative (G&A) costs and 100% more on customer success, according to the firm. In its chart of median spending, bootstrapped and equity-backed companies sit at about 10% and 17% of ARR on sales, 5% and 10% on marketing, 16% and 25% on R&D, and 11% and 18% on G&A (Lens reading of the chart).
A separate SaaS Capital post, dated 30 July 2026, puts median ARR per employee across all surveyed companies at $141,125, up from $129,724 a year earlier. It says bootstrapped companies reported higher ARR per employee than equity-backed ones at each revenue level. Among companies with $5 million to $10 million in ARR, the medians were $177,240 for bootstrapped and $152,295 for equity-backed companies.
Bootstrapped companies with $3 million to $20 million in ARR
A SaaS Capital post dated 24 April 2026 looks only at bootstrapped companies with $3 million to $20 million in ARR. Their median growth rate was 15%, and the 90th percentile grew 42.3%, down from 20% and 51% a year earlier.
Median NRR for the group was 103%, with the 90th percentile at 117.9%. Median gross revenue retention (GRR), which excludes upsells and price increases and cannot exceed 100%, was 91%, with the 90th percentile at 100%. SaaS Capital describes both retention measures as essentially flat on the previous year.
A table published with the post lists further medians for the same group: 40 employees, $159,757 of revenue per employee, an annual contract value of $21,579 and total spending of 96% of ARR.
For companies reported to have reached large revenue or valuations on little or no outside money, see Lens’s $20,000 to $401 Million: Seven Companies That Scaled on Little or No Outside Money.
Sources and notes
Read in full: SaaS Capital’s 2026 Private B2B SaaS Company Growth Rate Benchmarks summary page (dated 22 July 2026 in its page data); 2026 Benchmarking Metrics for Bootstrapped SaaS Companies, 24 April 2026, including its percentile table image; 2026 Spending Benchmarks for Private B2B SaaS Companies, 10 June 2026, including its chart of median spend by funding source; 2026 Revenue Per Employee Benchmarks for Private SaaS Companies, 30 July 2026; and, for the NRR and GRR definitions, What is a Good Retention Rate for a Private SaaS Company in 2025?, 18 September 2025. The full growth-rate report sits behind a download form and was not read. No 2026 retention benchmark page was found; the research-section address for that topic returned a “page not found” message. The department spending percentages above are Lens readings of a chart image; they match the percentage gaps stated in SaaS Capital’s text. The $3 million to $20 million table figures are taken from an image of a table. SaaS Capital expands ARR as “Annual Recurring Revenue” in its spending post and “Annualized Run Rate Revenue” in its bootstrapped post. The revenue-per-employee post is dated 30 July 2026 but carries a note saying it was updated in 2025. All figures are self-reported survey responses and were not independently checked. SaaS Capital lends to SaaS companies, including bootstrapped ones. Thumbnail photo: “Laptop and small plant on a desk in a modern workspace during daylight hours” by Shixart1985 via Wikimedia Commons, licensed under CC BY 2.0; cropped. A laptop on a white desk beside a small potted plant. Stand-in photo; it does not show the events or organisations described.
Image: Lens chart built from the figures above. Thumbnail: Shixart1985 via Wikimedia Commons (CC BY 2.0).

