


Private Equity and Venture Funds Hold 9 to 15 Percent of US Business Net Worth, Roosevelt Institute Estimates
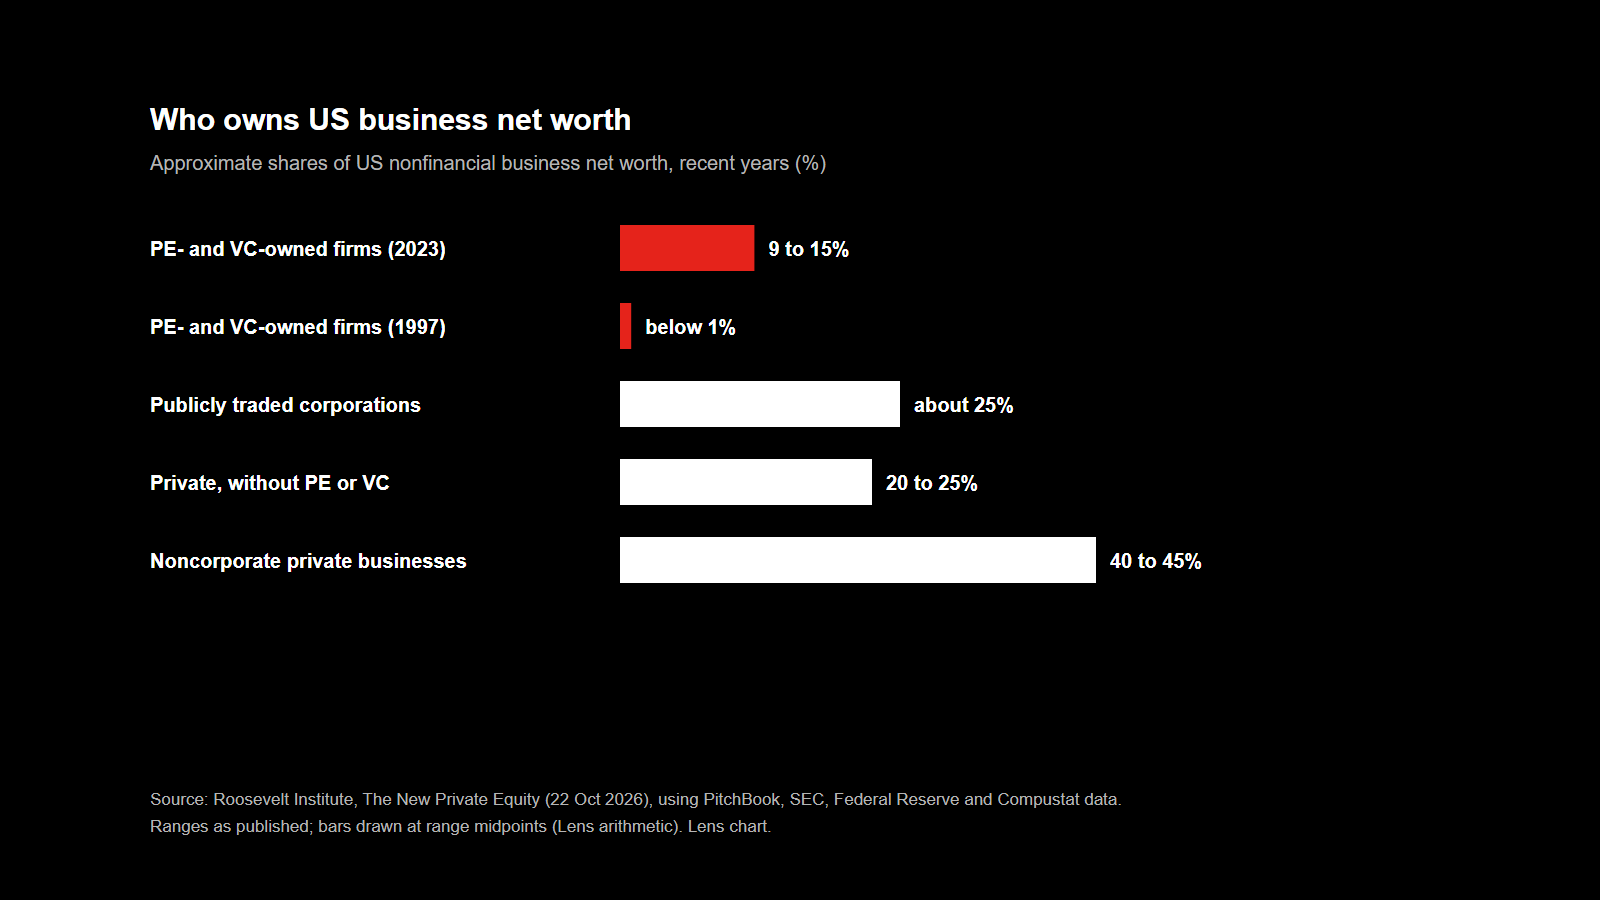

Companies owned by private equity (PE) and venture capital (VC) funds accounted for between 9 and 15 percent of the net worth of all US nonfinancial businesses in 2023, up from below 1 percent in 1997, according to a brief published by the Roosevelt Institute on 22 October 2026. The paper, “The New Private Equity”, is by Charlie Eaton of the University of California, Merced, Albina Gibadullina of Brown University, and Adam Goldstein and Marie-Lou Laprise of Princeton University. It draws on data from PitchBook, the Securities and Exchange Commission (SEC), the Federal Reserve and Compustat.
Two measures behind the range
The 9 percent figure uses PitchBook’s net asset value of US-based PE and VC funds, set against Federal Reserve data on the book value of nonfinancial business net worth, the authors write. Using filings that funds make to the SEC on Form PF, which they describe as more complete but available only for recent years, they put the share closer to 15 percent.
The SEC data show PE and VC fund gross assets rising from $1.9 trillion, or 9 percent of business net worth, in 2013 to $7.8 trillion, or 21 percent, in 2023. That total includes dry powder, money committed to funds but not yet invested. PitchBook reports that 30 percent of PE and VC assets were dry powder in 2023; removing that share leaves about $5.5 trillion invested, or around 15 percent, by the authors’ estimate. They report PE and VC together because the two are hard to separate in SEC reporting. Citing an EY study for the American Investment Council, a PE industry group, the authors add that US PE portfolio companies, excluding venture-backed firms, employed an estimated 13.3 million people in 2024, around 10 percent of private nonfarm employment.
Who owns the rest
By the brief’s figures, publicly traded corporations hold about 25 percent of nonfinancial business net worth. Private corporations without PE or VC owners fell from around 35 percent before the Great Recession to between 20 and 25 percent in the years since, and the authors write that PE and VC portfolio firms grew mainly at their expense. Noncorporate private ownership, common among small businesses, stayed between 40 and 45 percent throughout the period. The brief also counts a fall in companies traded on major US exchanges from over 6,000 in 1995 to just over 4,000 by 2020.
A separate count by Tomasz Tunguz, a venture capitalist at Theory Ventures, in a blog post dated 25 November 2025 that cites PitchBook and other data, puts US PE-owned companies at 14,300 in 2024, up from 1,950 in 2000. Over the same years, he writes, the number of US public companies fell from 6,639 to 3,550. He notes that PE-owned companies are smaller than public ones.
Deal data, 1985 to 2019
The brief’s deal analysis uses PitchBook records of 56,974 buyouts and 21,363 exits from 1985 to 2019, with missing deal sizes estimated by statistical imputation. The authors stop at 2019 because, they write, too many later deals lack reported sizes. Their findings include:
- The share of leveraged buyout (LBO) deal dollars involving public companies fell from more than 70 percent in the 1980s to less than 50 percent in almost all years since the early 1990s.
- Add-on buyouts, in which a PE-owned company buys another firm, grew to more than 40 percent of buyout deal dollars in 2018 in the imputed estimates.
- Initial public offerings (IPOs) fell from 20 to 25 percent of PE exits in the 1980s to less than 2 percent in 2020. Sales to other PE funds rose from about 20 percent of exits in the 1980s to nearly 50 percent in 2015 to 2020.
- The average time one fund held a company rose from around 2.5 years in the 1980s to 6 years in 2020.
The authors’ argument
The Roosevelt Institute describes itself as a policy and leadership institute that develops ideas to reorient the economy and democracy toward the common good. In the brief, the authors argue that PE has shifted from its 1980s role as corporate raider of public companies toward three other roles they name Main Street invader, buying already-private local businesses; monopoly builder, growing portfolio companies by acquiring competitors; and shadow owner, keeping companies private for longer, outside public reporting rules. The terms are the authors’ own, and they write that they do not use “monopoly” in a strict technical sense.
Sources and notes
The main source is the Roosevelt Institute brief The New Private Equity (PDF, dated October 2026), read in full from a text extraction, including the appendix on data sources. The 22 October 2026 publication date is from the institute’s web page for the brief. Tomasz Tunguz’s blog post was read in full; it now carries the title “Private Equity: The New Distribution Channel for AI Startups” and cites PitchBook, CRSP, the Wilshire 5000 index, the American Investment Council and Citizens Bank, none of which Lens checked directly. The EY employment study is cited by the brief and was not opened. The brief gives ranges, not point estimates, for most ownership shares, and its 9 and 15 percent figures come from different data. The authors note that PE and VC holdings are measured at fair value while the business net worth figures they compare them with are book values. Public company counts differ between the brief (Compustat, 1995 to 2020) and Tunguz’s post (2000 to 2024) because they use different sources and years. Thumbnail photo: “Manhattan skyline from Upper New York Bay, 20231001 1041 0889” by Jakub Hałun via Wikimedia Commons, licensed under CC BY 4.0; cropped. The office towers of Lower Manhattan's Financial District, including One World Trade Center, seen across Upper New York Bay. Stand-in photo; it does not show the events or organisations described.
Image: Lens chart built from the figures above. Thumbnail: Jakub Hałun via Wikimedia Commons (CC BY 4.0).

