


What a dollar buys in China and the US: construction, factories, apartments and a $500,000 household budget


Published figures put China’s overall price level at between about half and three-fifths of the US level, and the gap varies widely by category. Lens compiled published prices for electricity, cars, factories, rail, construction, wages and apartments from statistical agencies, companies, industry surveys and news reports, and calculated the ratio of the US price to the China price for each. All ratios, currency conversions and the household budget below are Lens calculations. Yuan amounts are converted at 6.8 per dollar.
Economy-wide measures
- Gross domestic product per person in 2026 is $95,212 in the US and $15,371 in China at market exchange rates, according to the International Monetary Fund’s DataMapper. Measured in purchasing power parity (PPP) dollars, China’s figure is $31,786. The US figure is about 6.2 times China’s at market exchange rates and 3.0 times at PPP.
- The World Bank’s International Comparison Program put China’s 2021 PPP at 3.99 yuan per dollar, equal to 61.8% of that year’s market exchange rate, according to China’s National Bureau of Statistics (NBS). The IMF’s 2026 figures imply a ratio of about 48%.
- The NBS reported average 2025 wages of 129,441 yuan (about $19,000) for employees of urban non-private units and 71,590 yuan (about $10,500) for urban private units. In the US, median weekly earnings of full-time wage and salary workers were $1,232 in the third quarter of 2026, and average hourly earnings of private-sector employees were $37.81 in September 2026, according to the Bureau of Labor Statistics (BLS).
Category by category
- Industrial electricity: €0.075 per kilowatt-hour in the US and €0.082 in China in 2024, according to BusinessEurope, which cites Eurostat. The US price is about 0.9 times China’s.
- Prime apartments: Manhattan apartment sales averaged $1,751 per square foot in the third quarter of 2026, according to Corcoran data, or about $18,850 per square metre. The Shanghai government reported in February 2025 that a new project in downtown Jing’an district averaged 119,411 yuan ($16,345) per square metre, or about $17,560 at 6.8 yuan per dollar. The Manhattan figure is 1.07 to 1.15 times the Jing’an figure, depending on the conversion.
- Cheapest new car: BYD’s 2026 Seagull starts at 69,900 yuan (about $10,300) in China, according to Electrek. The Hyundai Venue, which Edmunds describes as the cheapest new car on sale in the US, has a $20,550 base price according to Autoblog, or $22,650 with a $1,600 destination charge; Edmunds lists $21,695 including destination. On base prices the Venue costs about 2.0 times the Seagull. The two vehicles differ in size and type.
- Car factory: In its third-quarter 2019 update, filed with the US Securities and Exchange Commission, Tesla said Gigafactory Shanghai was “built in 10 months” and was “~65% less expensive (capex per unit of capacity) to build than our Model 3 production system in the US.” A cost 65% lower per unit of capacity is equal to about 2.9 times as much capacity per dollar.
- High-speed rail: A 2014 World Bank paper co-written by senior transport specialist Gerald Ollivier put China’s high-speed rail costs at $17 million to $21 million per kilometre, against $25 million to $39 million in Europe and about $56 million in California, Construction Management reported in July 2014. The California figure is 2.7 to 3.3 times China’s range.
- Wages by industry: The NBS reported 2025 averages of 113,594 yuan (non-private units) and 76,055 yuan (private units) in manufacturing, and 92,036 yuan and 66,275 yuan in construction. The manufacturing figures equal about $16,700 and $11,200. The BLS private-sector average of $37.81 an hour equals about $78,600 over 2,080 hours, 4.7 to 7.0 times the Chinese manufacturing averages; the BLS figure covers all private industries, not manufacturing alone.
- Construction cost: Turner & Townsend’s 2024 survey of 91 cities, using data collected in the first quarter of 2024, put average construction costs at $5,723 per square metre in New York and $909 in Shenzhen, the most expensive mainland Chinese city at 83rd place, according to the South China Morning Post. Guangzhou, Shanghai and Beijing ranked 84th to 86th, and mainland costs ranged from $893.9 to $909.5 per square metre. New York’s figure is 6.3 times Shenzhen’s. The firm’s 2025 edition, covering 99 markets, put New York at $5,744 and San Francisco at $5,504 per square metre.
Apartments
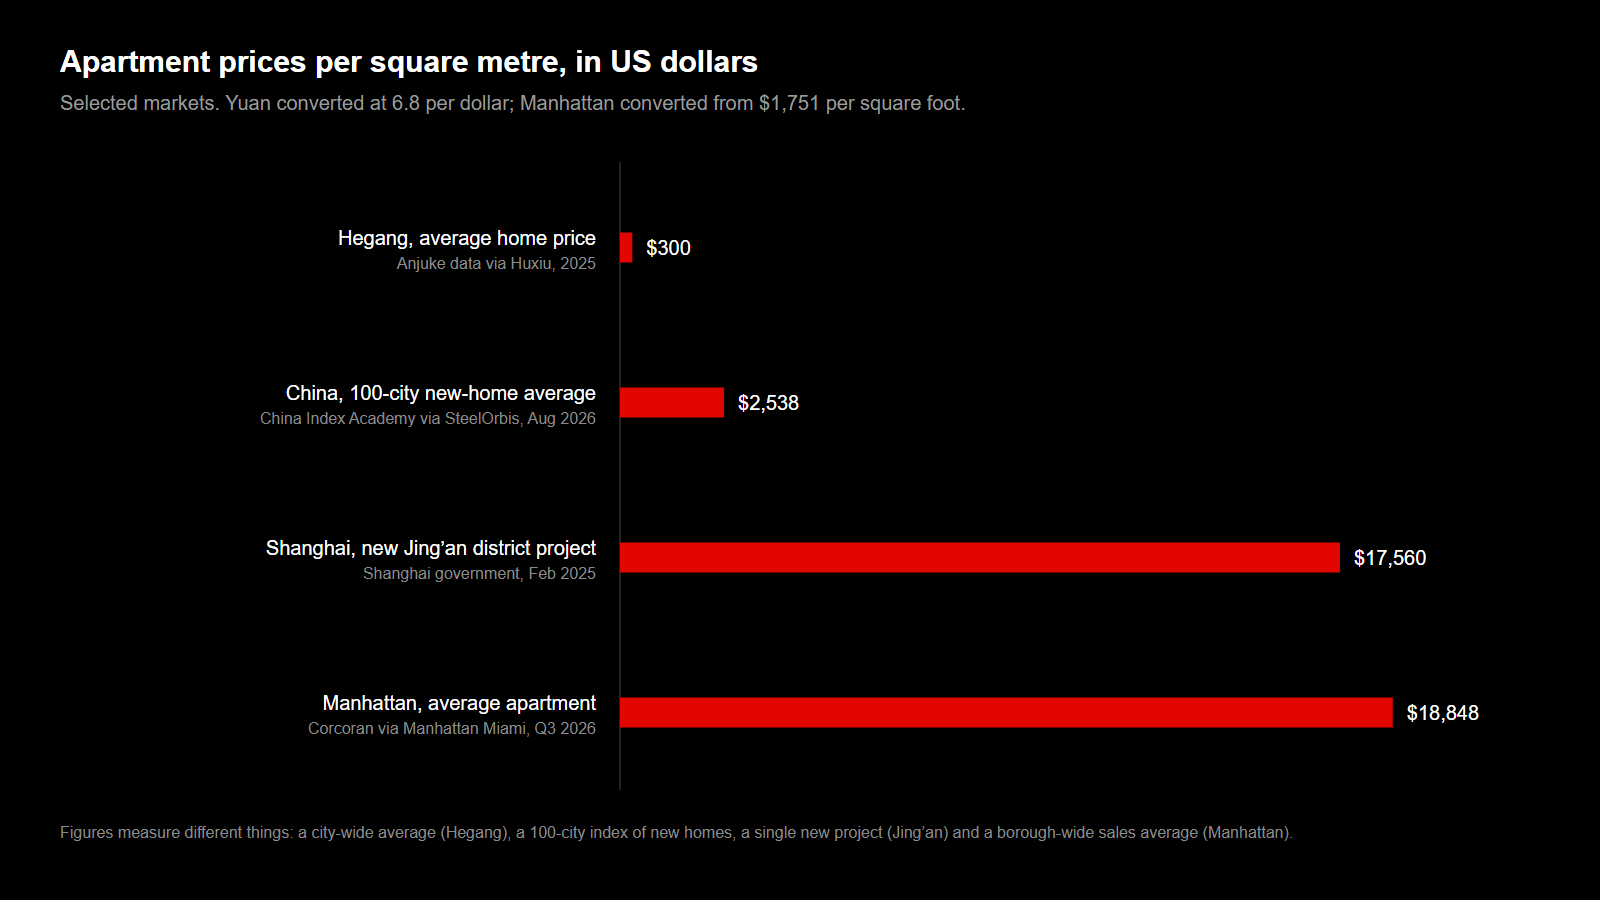
- Hegang, in Heilongjiang province, had an average home price of 2,041 yuan (about $300) per square metre in 2025, up from 1,980 yuan in 2024 and 1,695 yuan in 2023, according to Anjuke data cited in an article published on Huxiu in December 2025. The article said Hegang’s average price ranked last among Chinese cities, and that most of the very low-priced homes that drew attention in 2019 were old shantytown-renovation units that have since sold out.
- The average new-home price across 100 Chinese cities was 17,255 yuan (about $2,540) per square metre in August 2026, up 2.04% from a year earlier, SteelOrbis reported, citing China Index Academy data.
- In the US, Manhattan’s median apartment sale price was $1.25 million in the third quarter of 2026, according to Corcoran data. San Francisco’s median sale price averaged $1,644,139 a month from January to June 2026, and Detroit’s averaged $185,333 from January to March 2026, according to Redfin data published by Stacker.
- Lens calculations: a 60-square-metre home at Hegang’s 2025 average would cost about 122,000 yuan ($18,000). The San Francisco median is about 91 times that amount and the Manhattan median about 69 times. Within the US, the San Francisco median is 8.9 times Detroit’s and the Manhattan median 6.7 times. Within China, the Jing’an project’s price per square metre is 58.5 times Hegang’s average, and the 100-city average is 8.5 times. A 90-square-metre apartment at the Jing’an project’s average price would cost about 10.7 million yuan, equal to 83 years of the 2025 average wage in urban non-private units.
An illustrative $500,000 household budget
Goldman Sachs Asset Management’s 2026 Retirement Survey and Insights Report, based on 5,106 people surveyed in July 2026, found that 36.6% of respondents in households earning more than $500,000 said they “primarily live paycheck to paycheck,” IBTimes UK reported. The answers are self-reported.
Separately, Lens calculated an illustrative annual budget for a married couple in San Francisco with two earners paid $250,000 each, who buy a home at the median price with 20% down and pay for one infant in childcare. The calculation is not drawn from the survey.

- Federal income tax: $102,608, using 2026 IRS brackets and the $32,200 standard deduction for joint filers.
- Social Security and Medicare: $32,378, using the 2026 Social Security wage base of $184,500 for each earner, the 1.45% Medicare rate and the 0.9% additional Medicare tax on wages above $250,000.
- California income tax and State Disability Insurance (SDI): $44,816, using the Franchise Tax Board’s 2025 rate schedule and $11,412 joint standard deduction, and the 1.3% SDI rate for 2026 published by the Employment Development Department.
- Pay after these taxes: $320,198 a year, or $26,683 a month. Taxes total 36.0% of gross pay.
- Mortgage: $107,566 a year ($8,964 a month) in principal and interest on a 30-year loan of $1,315,311 at 7.24%, Freddie Mac’s average rate for the week of October 29, 2026, for a home at San Francisco’s $1,644,139 median price, with a $328,828 down payment.
- Property tax: $19,445, at the city’s 2025–26 secured property tax rate of about 1.18%.
- Infant childcare: $28,200 to $36,000 a year, the range between a 2026 DaycareCalc estimate for San Francisco center-based care and a Financial Samurai estimate.
- Retirement savings: $49,000 for two 401(k) contributions at the 2026 limit of $24,500 each.
- Remaining for all other spending, including food, health insurance premiums, transport, other insurance and travel: $108,187 to $115,987 a year, or about $9,000 to $9,700 a month.
In this calculation, the mortgage, property tax and childcare together take 48.5% to 50.9% of pay after taxes.
Sources and notes
Sources: IMF DataMapper (GDP per capita and PPP GDP per capita, retrieved November 3, 2026); NBS on the ICP 2021 results and 2025 average wages; BLS usual weekly earnings, Q3 2026 and Employment Situation, September 2026; BusinessEurope; Corcoran Q3 2026 data via Manhattan Miami; Shanghai government, February 10, 2025; Electrek, May 11, 2026; Autoblog; Edmunds; Tesla’s Q3 2019 update (SEC filing); Construction Management, July 25, 2014; South China Morning Post; Turner & Townsend, July 8, 2025; Huxiu, December 9, 2025; SteelOrbis, September 2, 2026; Stacker on San Francisco and Detroit; IBTimes UK; IRS 2026 brackets (via CPA Practice Advisor) and 401(k) limit; Social Security wage base; California Franchise Tax Board and Employment Development Department; Freddie Mac via FRED; DaycareCalc; Financial Samurai. Notes: Yuan amounts are converted at 6.8 per dollar, an approximation of onshore rates in September 2026; Lens did not use a November quote, and Shanghai’s own dollar conversion of the Jing’an price uses a different rate. The categories cover different years, from 2014 (rail) and 2019 (Tesla) to 2026. Tesla’s figure is the company’s own. The rail figures come from Construction Management’s report of the World Bank paper, and the 2024 construction figures from the South China Morning Post’s report of the survey; Lens did not read either underlying document or confirm what the construction cost figures include. The Manhattan figures come from a brokerage summary of Corcoran data. Stacker’s San Francisco page labels the figure San Francisco but its methodology note refers to metro-level data. Lens could not open Redfin’s own Detroit page, which search results showed with a lower figure for a later period. The apartment figures measure different things: a city-wide average (Hegang), a 100-city index of new homes, a single new project (Jing’an) and borough- or city-wide sales medians and averages (US). The Hegang article was first published by the WeChat account 读城记工作室. The California calculation uses the 2025 schedule because 2026 figures had not been confirmed; the San Francisco property tax rate is from third-party guides citing the city, and actual bills include further assessments. The childcare figures come from a cost-calculator website and a personal-finance blog. The budget excludes homeowner’s insurance, health premiums, food and other costs, and assumes all income is wages. The Goldman figures are as reported by IBTimes UK. Thumbnail photo: “Residential buildings Shanghai” by kallerna via Wikimedia Commons, licensed under CC BY-SA 4.0; cropped. Residential buildings near Nanpu Bridge, Shanghai, photographed in January 2020. Illustrative photo; it does not show any property named in this article.

Image: Charts by Lens from the sources listed. Thumbnail photo by kallerna via Wikimedia Commons (CC BY-SA 4.0).

